Mathematical Statistics
Mathematical statistics is the application of Mathematics to Statistics, which was originally conceived as the science of the state — the collection and analysis of facts about a country: its economy, and, military, population, and so forth.
Mathematical techniques used for this include mathematical analysis, linear algebra, stochastic analysis, differential equation and measure-theoretic probability theory.
Scope
Statistics is used in many sectors such as psychology, geology, sociology, weather forecasting, probability and much more. The goal of statistics is to gain understanding from data it focuses on applications and hence, it is distinctively considered as a Mathematical science.
Methods
The methods involve collecting, summarizing, analyzing, and interpreting variable numerical data. Here are some of the methods provided below.
- Data collection
- Data summarization
- Statistical analysis
Data
Data is a collection of facts, such as numbers, words, measurements, observations etc.
Types of Data-
- Qualitative data- it is descriptive data.
- Example- She can run fast, He is thin.
- Quantitative data- it is numerical information.
- Example- An Octopus is an Eight legged creature.
Types of quantitative data
- Discrete data- has a particular fixed value. It can be counted
- Continuous data- is not fixed but has a range of data. It can be measured.
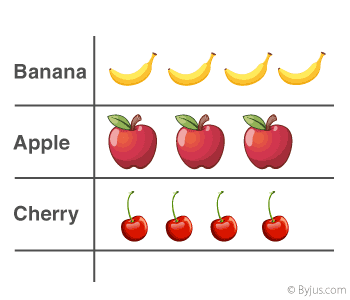
Representation of Data-


Formulas used
| Sample Mean ( | |
| Population Mean ( | |
| Sample Standard Deviation (s) | |
| Population Standard Deviation ( | |
| Sample Variance ( | |
| Population Variance ( | |
| Range (R) | Largest data value – smallest data value |
Post a Comment